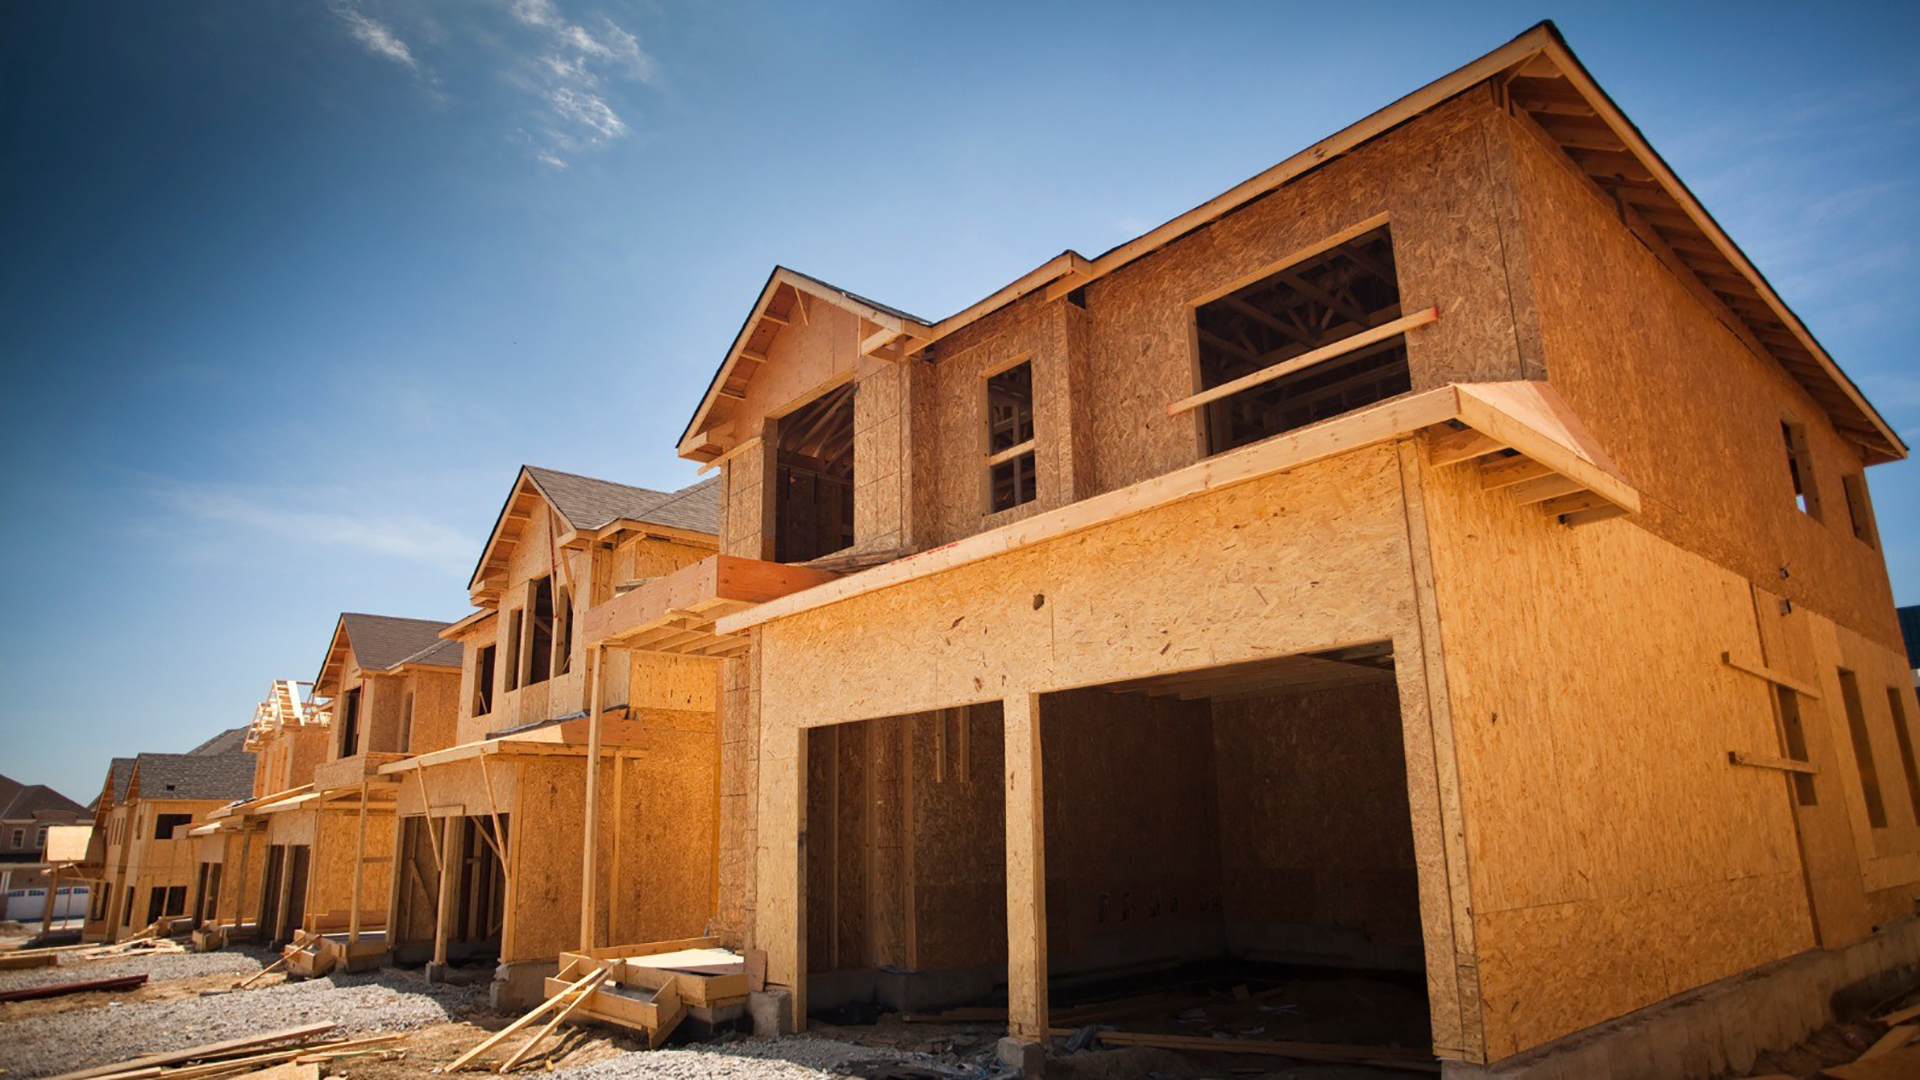
Share of Builders Cutting Home Prices Drops from 22% to 15%

By Housing

As lockdown orders began to ease in May and June 2020, housing data rebounded quickly, providing evidence that this industry is positioned to lead the economy forward. Single-family permits rose almost 12% in May, mortgage applications are at their highest level since January 2020, and builder sentiment, measured by the NAHB/Wells Fargo Housing Market Index (HMI), jumped 21 points in June – the highest one-month increase in the series history.

At the onset of the COVID-19 pandemic, there were rumors about builders lowering home prices as a result of the crisis. Last month’s HMI survey revealed that in fact only 22% of builders nationwide cut prices in April 2020. This month’s survey reveals that the share of builders reducing prices to bolster sales dropped even lower in May 2020, down to 15%. For historical context, 49% of builders cut prices in March 2008, in the midst of the last housing recession (Figure 1).

Builders who did reduce home prices in May 2020 cut them by an average of 5%, the same discount reported a month earlier. In contrast, builders were reducing home prices more aggressively in May 2007 (7%) and March 2008 (8%) (Figure 2).

Virus Impacts: Single-Family and Multifamily Market Concentrations

By Housing

The first quarter of 2020 witnessed a shift in home building towards less population-dense housing markets in the United States, a trend which was greatly hastened by the onset of COVID-19. While most states issued statewide stay-at-home orders with exemption for construction, some of the hardest-hit states had no exemptions for construction when the pandemic first hit. While NAHB’s Home Building Geography Index (HBGI) focuses on county-level homebuilding developments, it is also informative to look at the relationship between COVID-19-associated deaths per capita by state and single- and multifamily permit issuances per capita by state.

The above figure shows the number of single-family permits issued in March plotted against deaths per 100,000 persons, by state. As expected, some of the states which had the highest population-adjusted, COVID-19-associated deaths, New York, New Jersey, and Connecticut also feature relatively lower permit numbers. At the same time, these states also have a larger share of multifamily markets than other states.

It is worth noting that while New York, New Jersey, and Connecticut had the highest COVID-19-associated fatality rates, the multifamily housing demand in these states was still robust as of the end of the first quarter. Among all of the states’ population-adjusted, multifamily permit issuances for March, Connecticut’s permit number was at the 50th percentile, i.e., represented the median of all states’ population-adjusted multifamily permit issuances, while New York and New Jersey were above the 50th percentile.

Deaths per capita appear more concentrated in larger multifamily markets, while deaths per capita are less concentrated in larger single-family markets. These broad correlations are consistent with the NAHB forecast indicating the single-family market will be less affected.

Purchasing and Refinance Activity Thrive Amid Low Rates

By Housing

As the Mortgage Bankers Association’s 30-year fixed-rate mortgage rate reached a new historic low of 3.3%, sliding down by 8 basis points from the previous week, its benchmark Market Composite Index increased by 8% from the previous week, on a seasonally adjusted basis. Purchase applications increased to the highest level in over 11 years and for the ninth consecutive week. Refinancing activity also posted gains, not only on a weekly basis, but also on a year-over-year basis.

The refinancing and purchasing gains come amid the sharp competition which the pandemic has given rise to for prospective homebuyers. The underlying reasons for this are low home inventory, thus enabling bidding wars among nearly half of homeowners who made a purchase between January and May, according to a recent study. With the Federal Reserve’s recent announcement of an accommodative monetary stance in order to aid recovery efforts, a low-interest rate environment is bound to continue for the short-term, effectively benefiting housing demand.

Supreme Court Affirms DACA; Decision Upholds an NAHB-Supported Legal Precedent

By Industry News

The U.S. Supreme Court today ruled that the federal government’s decision to rescind the Deferred Action for Childhood Arrivals (DACA) policy is subject to judicial review. This means that roughly 700,000 “Dreamers” (undocumented immigrants brought to the U.S. illegally as children and who grew up knowing America as their only home) can continue to reside and work legally in the United States.

This case follows a line of recent opinions where the Supreme Court has held that government actions that impact private interests are eligible for judicial review, and represents an important victory for NAHB members.

In this case, the Supreme Court held that the administration failed to adhere to the Administrative Procedure Act when it sought to rescind the DACA policy. In 2012, the Obama administration, through a memorandum issued by the U.S. Department of Homeland Security, announced its intention to forego deportation proceedings against a class of Dreamers – people who were brought to the U.S. illegally as children. A number of DACA recipients are involved in the construction industry and DACA recipients also participate in NAHB’s student chapters, especially in California and Texas.

NAHB, with its coalition partners, provided an amicus brief to the Supreme Court, arguing that private entities should be able to challenge federal agency action in court when those actions impact their interests. Without broad-based judicial review, NAHB’s members would be unable to challenge many agency actions that adversely impact them. The brief also explained the importance of the immigrant workforce to the construction industry.

The cases under consideration at the Supreme Court were all in the early stages of litigation, and the high court has now returned those opinions to the lower courts for consideration.

For more information, contact Amy Chai at 800-368-5242 x8232

Initial and Continuing Jobless Claims Decline Slightly

By Housing

Weekly initial jobless claims declined slightly in the week ending June 13 and continuing claims, which lags initial jobless claims by one week, declined to 20.5 million in the week ending June 6. While some workers are returning to work, albeit slowly, as coronavirus restrictions are gradually eased, others are being laid off as companies are closing permanently in wake of the COVID-19 crisis.

The U.S. Department of Labor released the Unemployment Insurance Weekly Claims Report for the week ending June 13. In the week ending June 13, the number of initial jobless claims declined slightly by 58,000 to a seasonally adjusted level of 1,508,000, compared to the revised previous week’s claims of 1,566,000. It marks the eleventh straight week of declines in initial claims since the week ending March 28 when it hit a record peak of 6.9 million. The four-week moving average decreased to 1,773,500, from a revised average of 2,008,000 in the previous week. This week’s new claims brought the thirteen-week total to 45.7 million.

Meanwhile, the number for seasonally adjusted insured unemployment, known as continuing claims, declined slightly by 62,000 to a seasonally adjusted level of 20,544,000 in the week ending June 6. The four-week moving average was 20,814,750, a decrease of 1,092,000 from the previous week’s revised average. The seasonally adjusted insured unemployment rate remained unchanged at 14.1% for the week ending June 6. The previous week’s rate was revised down by 0.3 percentage point from 14.4% to 14.1%.

The U.S. Department of Labor also released the advanced number of actual initial claims under state programs without seasonal adjustments. The unadjusted number of advanced initial claims totaled 1,433,027 in the week ending June 13, a decrease of 128,240 from the previous week.

The chart below presents the top 10 states ranked by the number of advanced initial claims for the week ending June 13. California, Georgia and New York had the most advanced initial claims. California led the way with 243,344 initial claims, followed by Georgia with 130,766 initial claims and New York with 96,299 initial claims. Like the previous week, South Dakota, Vermont and Wyoming had the least advanced initial claims across all the states.

Compared to the previous week, Texas (+4,219), Nevada (+3,651) and Washington (+2,974) reported the largest increases in advanced initial claims for the week ending June 13. Florida (-25,863), Oklahoma (-20,788), and Maryland (-18,736) had the largest decreases in advanced initial claims.

Remodelers’ Net Profit Margins Are Flat

By Housing

The residential remodeling industry, just like any other private industry in the American economy, operates on the basis of competition and profits. Companies enter, stay or exit the industry of their own volition, driven by consumer demand for their services and the expectation of a rate of return commensurate with the risk taken. Because reliable information is critical to make sound business decisions, industries can help their current and potential members by producing average aggregate levels of profitability and indicators of financial health. For this reason, the National Association of Home Builders periodically conducts the Remodelers’ Cost of Doing Business Study – a nationwide survey of residential remodeling companies designed to produce profitability benchmarks for that segment of the construction industry. The latest study collected information for fiscal year 2018 and compares findings to fiscal years 2011 and 2015.

The 2020 edition of the study shows that while gross profit margins increased slightly, net margins have been flat. On average, remodelers reported $2.3 million in revenue for fiscal year 2018, of which $1.6 million (69.9%) was spent on cost of sales (e.g., labor, material, and trade contractor costs) and another $563,000 (24.8%) on operating expenses (e.g., general and administrative, finance, and S&M expenses, owner’s compensation). As a result, the industry average gross profit margin for 2018 was 30.1%, with a net margin of 5.2%.

The figure below puts these margins in historical context. It shows that remodelers have been able to effectively reduce their cost of sales (as a % of revenue) in recent years, allowing them to increase their gross profit margin up from 26.8% in 2011, to 28.9% in 2015, and then to 30.1% in 2018. Higher operating expenses swallowed up higher gross margins in 2018, however, and remodelers averaged a net profit margin of 5.2%, essentially the same as in 2015 (5.3%), but significantly better than in 2011 (3.0%).

In terms of the balance sheet, residential remodelers reported an average of $421,000 in total assets for fiscal year 2018. Of that, $220,000 (52.3%) was owed as either current or long-term liabilities, and the remaining $200,000 (47.7%) was owned free and clear by the remodelers.

Looking back shows that remodelers’ average total assets increased by more than 50% from 2011 to 2015, rising from $269,000 to $414,000. By 2018, however, average assets were only 2% higher than in 2015, at $421,000.

The figure below also shows remodelers lowering their reliance on debt to run their businesses. In 2011, they reported liabilities equivalent to 65% of their assets; by 2015, they were up to 68%. But in 2018, total liabilities decreased to represent only 52% of remodelers’ total assets. Meanwhile, on the equity front, remodelers in 2018 reported the largest average amount of invested capital ($200,000) in this series, and that financed nearly half (48%) of their assets that year. In contrast, only 35% and 33% of remodelers’ assets were financed by their own equity in 2011 and 2015, respectively.