

NAHB analysis of the Census Construction Spending data shows total private residential construction spending stood at a seasonally adjusted annual rate (SAAR) of $536.8 billion in April. It was down 4.5% in April, after a 0.2% dip in March, due to the economic consequences of the COVID-19 lockdowns. On a year-over-year basis, however, total private construction spending rose 6.2%.
The monthly declines are largely attributed to the slowdown of spending on single-family and multifamily construction. Spending on single-family construction slid down 6.6% in April to a seasonally adjusted annual rate of $281.0 billion, after a decrease of 1.5% in March. This decline mirrors broader declines in single-family starts in April. Multifamily construction spending plunged 9.1% in April, following a dip of 0.1% in March. Private residential improvements, which include spending on remodeling, major replacements, and additions to owner-occupied housing units, stayed flat at a $202.2 billion annual pace in April.
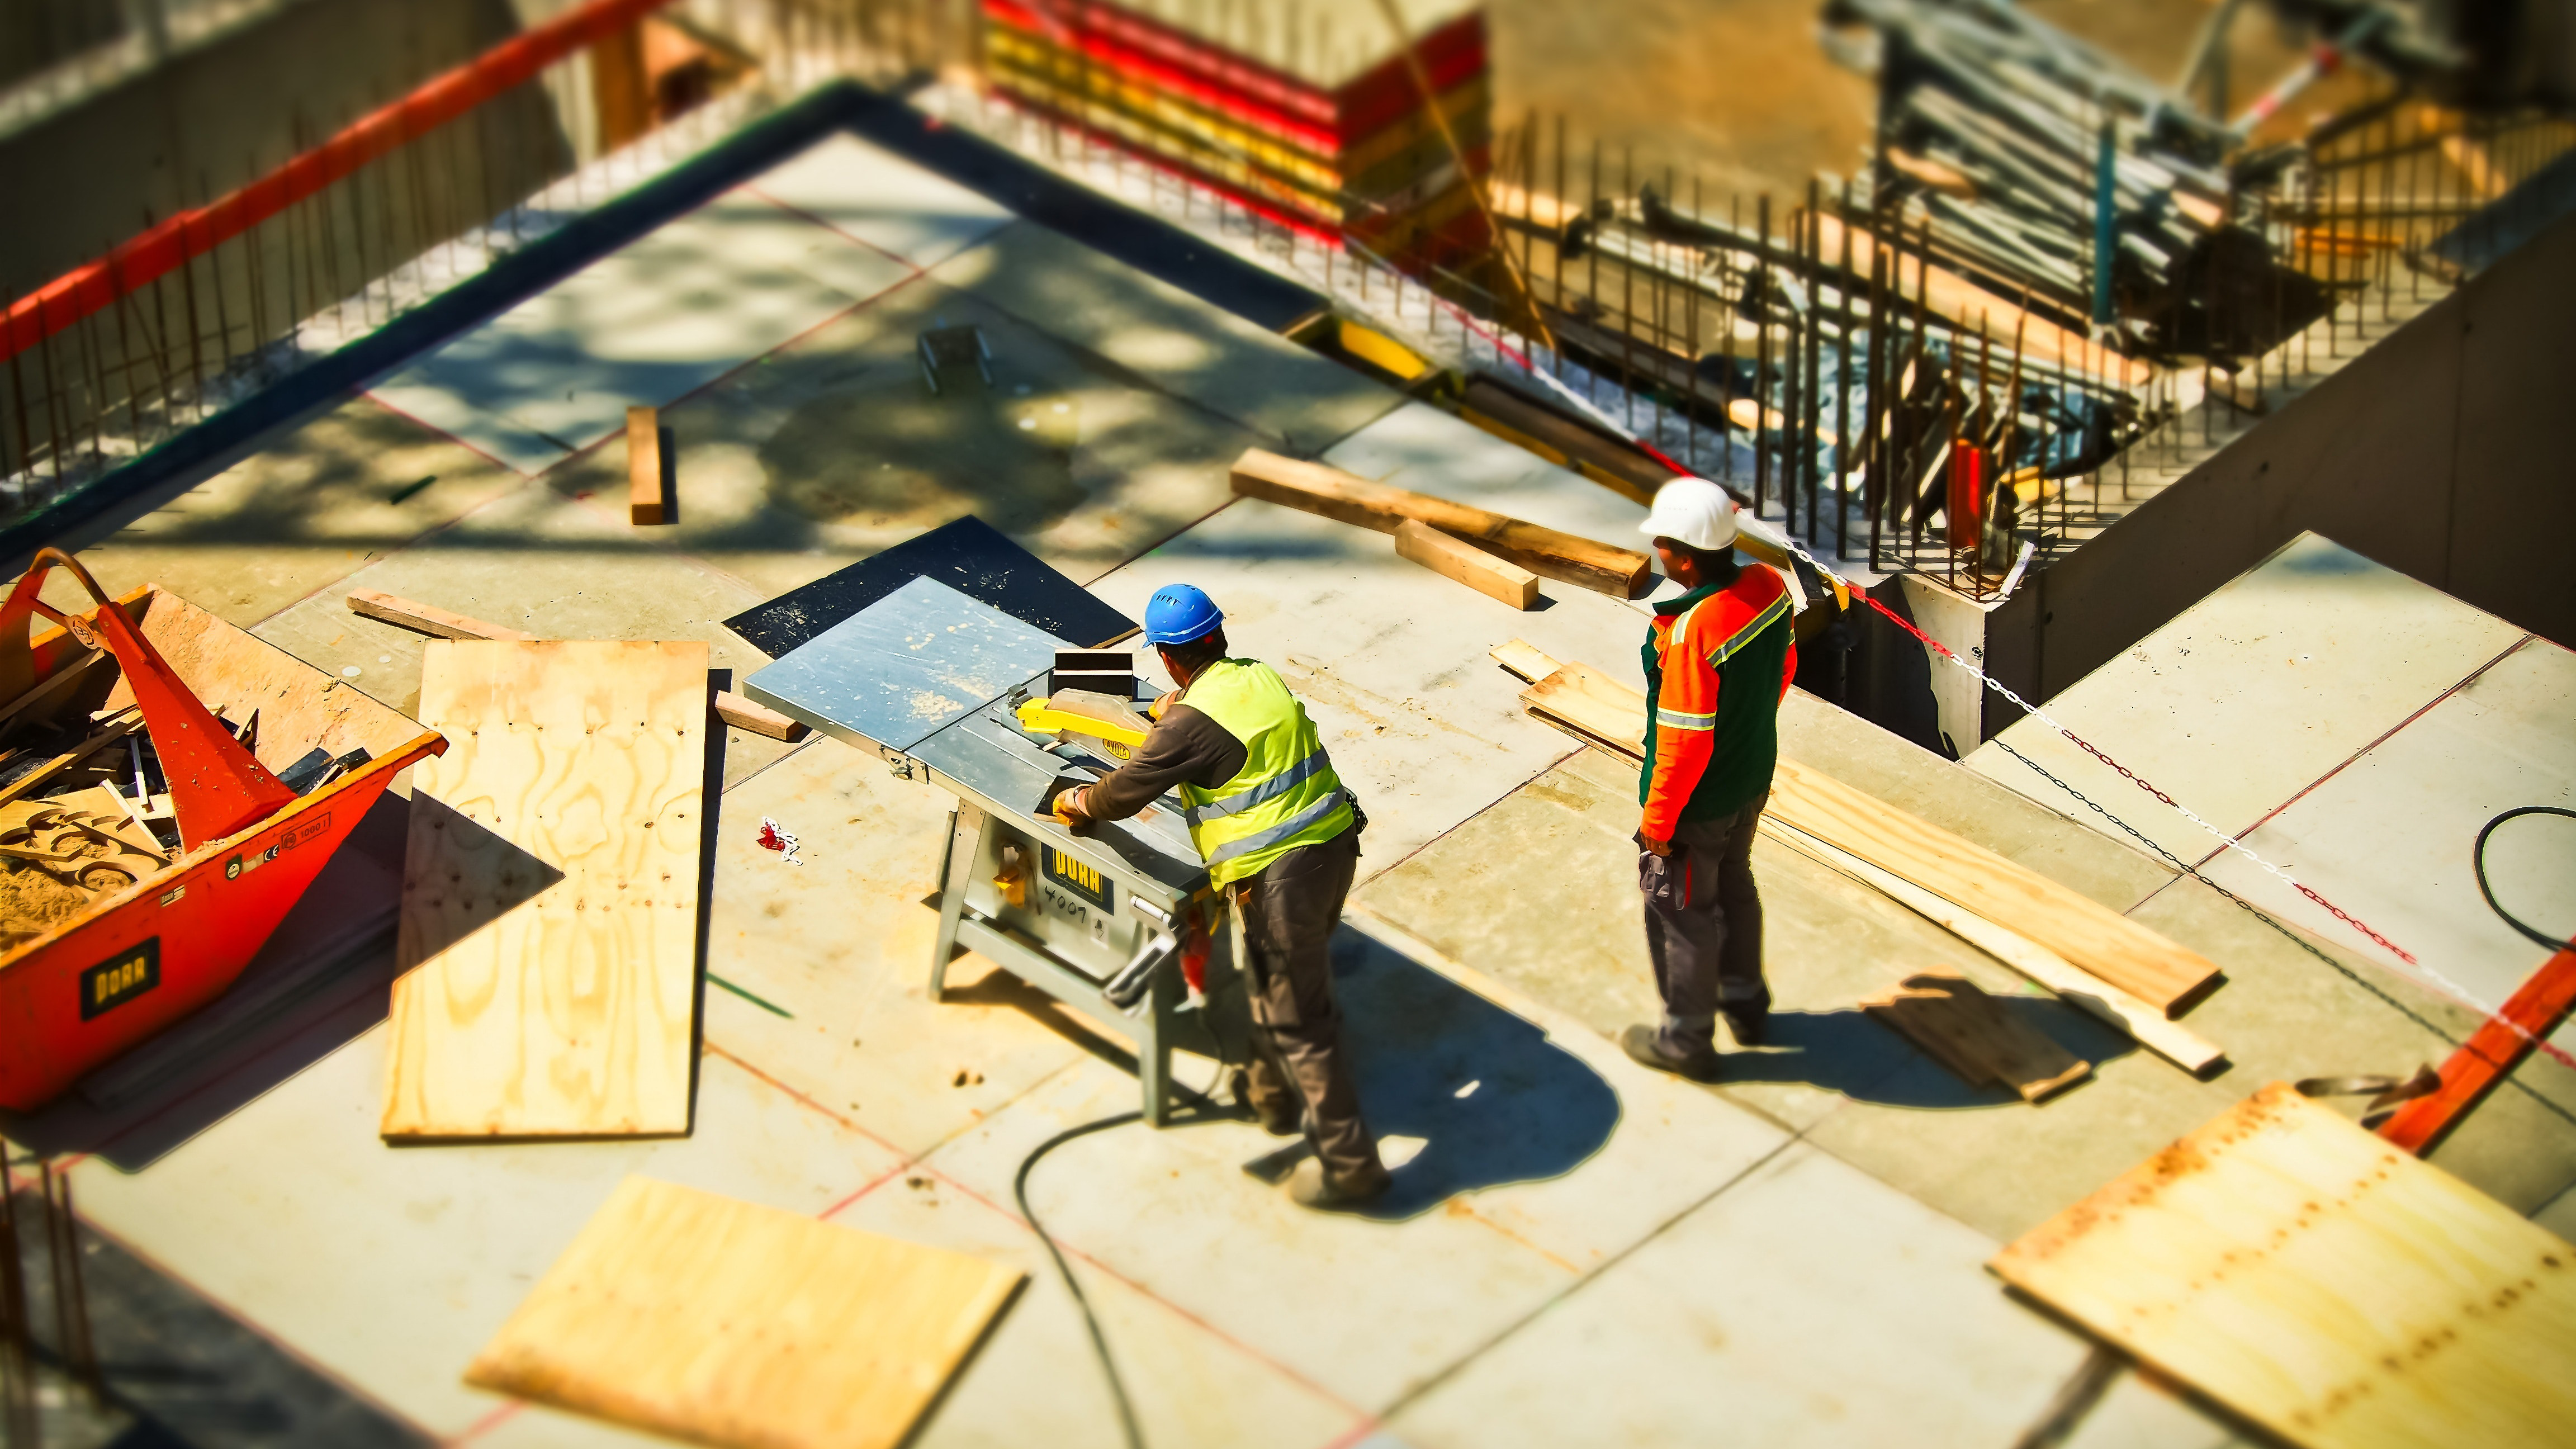
The NAHB construction spending index, which is shown in the graph below (the base is January 2000), illustrates the solid growth in single-family construction and home improvement from the second half of 2019 to February 2020, before the COVID-19 hit the U.S. economy. New multifamily construction spending has slowed since August 2019, after strong growth from 2010 to 2016 and a surge from late 2018 to early 2019.

Spending on private nonresidential construction declined 1.3% in April to a seasonally adjusted annual rate of $467.2 billion. The monthly nonresidential spending decline was mainly due to less spending on the class of commercial ($2.0 billion), followed by the educational category ($1.5 billion), and power ($1.1 billion).


 With one major exception, this week’s housing data showed some signs of stabilization after an effective two-month pause for major portions of the U.S. economy. While most indicators are down year-over-year, there are hints of a rebound in the data, provided businesses can continue to reopen as the virus slows its growth. As the housing sector enters this recession underbuilt, it is a sector with both pent-up housing demand and sensitivity to low interest rates, which places it in a good position to recover more quickly than other sectors of the economy.